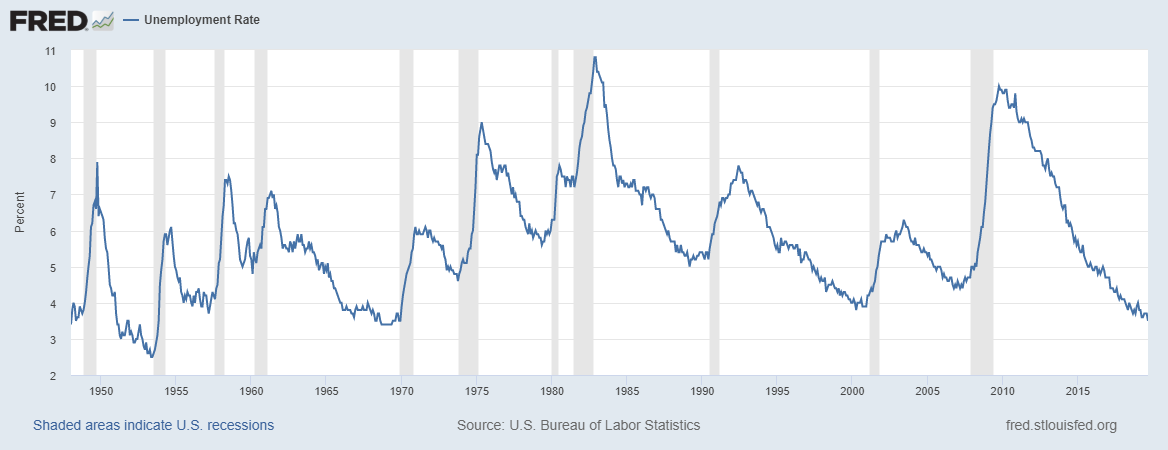
• About Us
  • InVEST Risk Model
  • Blog
  • Client Login

TJT Capital Group, LLC

Asset management, money management, investment management, risk management, Stamford, CT

  • About Us
  • InVEST Risk Model
  • Blog
  • Client Login

October 2019 Insights

October 3, 2019

The S&P 500 index gained 1.7 percent in September despite headwinds from slowing global growth, the ongoing trade war with China, rising geopolitical tensions in the Middle East, and the new impeachment inquiry into President Trump. The S&P 500 closed out September at 2976.74, compared to 2980.38 at the end of July and 2913.98 on September 30, 2018.

Since the Federal Reserve initially cut interest rates on July 31, 2019, the S&P 500 was roughly flat at the end of September, and had gained 2.3 percent over the previous twelve months. Clearly the trade tensions have had a lot to do with that, and it has been an exhausting exercise. One day President Trump bashes China at the United Nations General Assembly, and literally the next day he says a deal with China “could happen sooner than you think.”

President Trump’s supporters suggest his version of “3-D chess”- a complicated negotiating game that works to his advantage – is helping, while his detractors say it is an indication of an ad hoc policy that changes depending on what the markets are doing at that time.

Click here to read the full report.

September 2019 Insights

September 3, 2019

On August 31, 2018, the S&P 500 index closed at 2901.52. One year later, on August 31, 2019, the S&P 500 stood at 2926.46, a gain of 0.85 percent with some significant swings in volatility along the way.

On July 31, 2019, the Federal Open Market Committee (FOMC) cut interest rates for the first time following nine rate hikes between 2015 and 2018. The S&P 500 was 2980.38 at that time. Over the next few weeks the S&P 500 had three daily declines that were greater than 2.5 percent, and it closed down 1.8 percent in the month of August. Clearly there is a lot going on, and interest rate cuts are not a panacea.

The ongoing trade war, questionable Federal Reserve policy, slowing global growth, drastic currency moves, and an economic crisis in Argentina are but a few of the major issues weighing on the markets.

Click here to read the full report.

Conference Board Leading Economic Index (LEI)

August 22, 2019

The Conference Board Leading Economic Index (LEI) is a subcomponent in the Economic cycle indicator in TJT’s proprietary InVEST Risk Model®.

The LEI for the U.S. increased 0.5 percent in July to 112.2, following a 0.1 percent decline in June, and a 0.1 percent decline in May.  In the six-month period ending in July, the LEI increased 0.8 percent.

Contact us to learn why this is important when managing your money.


August 2019 Insights

August 2, 2019

The S&P 500 index gained 1.3 percent in July and recorded its first close above the 3000 level in history, however, the index fell 1.5 percent in the last few days of the month as the Federal Reserve cut interest rates for the first time since 2008.

Click here to read the full report.

Mutual Fund and ETF Flows

July 25, 2019

Mutual fund and ETF flows are a subcomponent in the Sentiment indicator in TJT’s proprietary InVEST Risk Model®.

Contact us to learn why this is important when managing your money.

Click HERE to read the WSJ article.


July 2019 Insights

July 2, 2019

The U.S. stock market rallied in June following one of the worst monthly declines in May as President Trump’s threat to place tariffs on Mexico were cancelled, the Federal Reserve hinted of a July interest rate cut, and hopes for a truce in the ongoing trade war with China increased.

The Dow Jones Industrial Average (DJIA) rallied 7.1 percent in June, the biggest June rally in about 81 years, after declining by 6.6 percent in May. However, despite the attention-grabbing headline, the DJIA ended the month of June approximately 7 points higher than the April 30, 2019 closing level.

Moreover, although the markets have enjoyed an impressive first half in 2019, consider this: the “Dow” had to have the best monthly gain since 1938 in order to close just below a level it reached in January 2018 – about eighteen months ago. Clearly the markets have experienced massive volatility without much progress. In fact, even the S&P 500 index has gained just 2.4 percent from January 2018 to June 28, 2019.

Click here to read the full report.

June 2019 Insights

June 4, 2019

The escalation of the trade war between the U.S. and China is starting to bite as the S&P 500 index fell by 6.5 percent in the month of May. As a reminder, over a year ago, on March 2, 2018, President Trump wrote on Twitter “trade wars are fun, and easy to win.”

On April 29, 2019, The Wall Street Journal ran a headline “Mnuchin Suggests China Trade Talks Could Wrap Up by End of Next Week.” At the conclusion of the last public meeting between the U.S. and China on May 10, 2019, Treasury Secretary Steve Mnuchin said the talks were “constructive.” A few hours later President Trump threatened China with tariffs on an additional $325 billion worth of goods from China.

In late May President Trump announced plans to impose tariffs on goods coming into the U.S. from Mexico. The uncertainty around global trade is destabilizing at best. It is clear that the Treasury Secretary’s May 10th trade talks were anything but “constructive.” The fact of the matter is we live in a global economy with supply chains all over the world. The notion that trade policy can change with one tweet is unsettling to say the least.

Click here to read the full report.

Yield Curve

May 14, 2019

The yield curve is a subcomponent in the Interest Rate indicator in TJT Capital Group’s proprietary InVEST Risk Model®.

The yield curve inverted briefly in March (3/22 to 3/29) and inverted again yesterday (5/13).  An inverted yield curve is when short-term rates are higher than long-term rates.

The significance of an inverted yield curve is that it preceded the last three downturns as seen in the chart below, and has also preceded every recession over the past 50 years.

Schedule an appointment to speak with an advisor to learn how TJT would manage your investment portfolio.

May 2019 Insights

May 2, 2019

The S&P 500 index rose to an all-time high of 2943.83 following a 3.9 percent gain in the month of April boosted by a stronger-than-expected Gross Domestic Product (GDP) report and generally solid corporate earnings. The rhetoric from the ongoing trade tensions with China has been toned down, however, a comprehensive deal remains elusive as issues of enforcement and the roll-back of tariffs remain unresolved.

Click here to read the full report.

  • « Previous Page
  • 1
  • …
  • 8
  • 9
  • 10
  • 11
  • 12
  • 13
  • Next Page »

On Our Radar Highlights. When It Mattered Most

Download PDF

Contact Us

9 W. Broad St
Stamford, CT 06902
(p) (877) 282-4609
(f) (203) 504-8849
info@tjtcapital.com

Social Links

  • Facebook
  • LinkedIn
  • Twitter

Important Disclosures

  • Disclosure Information
  • Privacy Policy
  • Firm Brochure
  • Form CRS

More Resources

  • Fed’s Response to Crisis
  • Fed Aftermath of Crisis
  • Psychology of Investing
    • Price Matters
Copyright © 2025 TJT Capital Group. All rights reserved.
Site By Objectiv