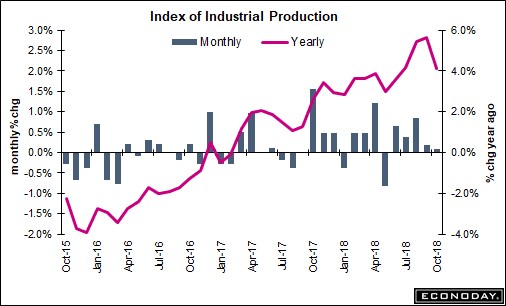
• About Us
  • InVEST Risk Model
  • Blog
  • Client Login

TJT Capital Group, LLC

Asset management, money management, investment management, risk management, Stamford, CT

  • About Us
  • InVEST Risk Model
  • Blog
  • Client Login

Leading Economic Index (LEI)

July 19, 2018

The LEI is a subcomponent in the Economic cycle indicator in TJT’s proprietary InVEST Risk Model ®. 

Contact us to learn why this is important when managing your money.


July 2018 Insights

July 3, 2018

Ongoing trade tensions dominated the headlines and market action in the month of June as concerns mounted that any tariffs imposed by the U.S. against our trading partners would be met with swift retaliation. The tit-for-tat threat of a trade war saw an escalation in rhetoric as China’s President Xi reportedly said “In the West you have the notion that if somebody hits you on the left cheek, you turn the other cheek…In our culture we punch back.”


Despite that, the S&P 500 index eked out a 0.48% gain in June, excluding dividends…


Click here for full report.

June 2018 Insights

June 4, 2018

Uncertainty over trade policy and elevated trade tensions, rising political instability, and the Federal Reserve tapping on the brakes have caused volatile swings in stocks, bonds, commodities and currencies. Higher debt levels across the board make economies more sensitive to higher interest rates, and interest rate spikes due to political uncertainty can have ripple effects across markets. (6.4.18)

Click here for full report.

Employment Report

June 1, 2018

The unemployment rate fell to 3.8%, the lowest since April 2000.  The US  has had 11 recessions over the past 70 years.  Historically, the unemployment rate turned up, on average, several months before a recession began.

May 2018 Insights

May 1, 2018

The U.S. stock market was roughly flat in the month of April following some wide swings, and both the S&P 500 Index and the bond market are down on a year-to-date basis, something that has not happened in years.

The stock market has been in a correction phase since late January and volatility has increased due to concerns of a potential trade war with China, rising interest rates, and growing tensions in Syria and Iran. Following President Trump’s initial proposal to slap tariffs on steel and aluminum imports, China swiftly retaliated with announced tariffs of their own, including a 25 percent tariff on critical U.S. exports including soybeans, the biggest U.S. agricultural export to China, and airplanes. Although the proposed tariffs would not go into effect for months, if ever, clearly the threats are creating a heightened level of uncertainty for the markets.

Meanwhile, oil prices have been on the rise as a barrel of West Texas Intermediate hit $68, the highest level in four years as seen below, and the yield on the ten-year U.S. Treasury Note hit 3 percent during April, a level last seen in January 2014.

TJT Capital Group’s InVEST Risk Model® has helped our clients participate in bull markets and protect capital from the devastation of bear markets by focusing on 5 indicators that really matter when it comes to determining the health and direction of markets. The following is the most recent update.

Check out the full report here.


April 2018 Insights

April 5, 2018

The S&P 500 index experienced its first down quarter since 2015 on concerns about the rise in interest rates, a potential trade war with China, and privacy issues with some of the leading technology companies that may lead to increased regulation. The S&P 500 fell 2.68 percent in the month of March and was down 1.2 percent in the first quarter, excluding dividends.

Volatility has also returned to the markets with the S&P 500 registering six trading days of plus or minus 2 percent moves compared to zero in 2017. The Dow Jones Industrial Average (DJIA), more specifically, saw swings of minus 724, plus 669, minus 345 and plus 254 in the last few days of March.

Interest rates have moved higher as the yield on the three month U.S. Treasury Bill rose to 1.73 percent from 1.39 percent at year-end, while the ten-year Treasury yield rose to 2.74 percent from 2.40 percent over the same period.

TJT Capital Group’s InVEST Risk Model® has helped our clients participate in bull markets and protect capital from the devastation of bear markets by focusing on 5 indicators that really matter when it comes to determining the health and direction of markets. The following is the most recent update.

Check out the full report here


February 2018 Insights

February 1, 2018

DJIA 26,186.71

After going well over a year without even a 3 percent pullback, there are signs that have been present prior to episodes of market turbulence in the past.

Check out the full report here

July 2016 Insights

July 5, 2016

DJIA 17,840.62

If those earnings come in and the price/earnings ratio remains at current levels, the market could see a low double-digit
gain from here.

Check out the full report here


March 2016 Insights

March 2, 2016

DJIA 16,899.32

The combination of our five key variables keeps our risk “Traffic Light” in “green light” territory and we
expect higher prices.


Check out the full report here

  • « Previous Page
  • 1
  • …
  • 10
  • 11
  • 12
  • 13
  • Next Page »

On Our Radar Highlights. When It Mattered Most

Download PDF

Contact Us

9 W. Broad St
Stamford, CT 06902
(p) (877) 282-4609
(f) (203) 504-8849
info@tjtcapital.com

Social Links

  • Facebook
  • LinkedIn
  • Twitter

Important Disclosures

  • Disclosure Information
  • Privacy Policy
  • Firm Brochure
  • Form CRS

More Resources

  • Fed’s Response to Crisis
  • Fed Aftermath of Crisis
  • Psychology of Investing
    • Price Matters
Copyright © 2025 TJT Capital Group. All rights reserved.
Site By Objectiv