The S&P 500 index rose to an all-time high of 2943.83 following a 3.9 percent gain in the month of April boosted by a stronger-than-expected Gross Domestic Product (GDP) report and generally solid corporate earnings. The rhetoric from the ongoing trade tensions with China has been toned down, however, a comprehensive deal remains elusive as issues of enforcement and the roll-back of tariffs remain unresolved.
April 2019 Insights
The S&P 500 gained 1.79 percent in March to close at 2834.40 as optimism over the trade negotiations between the U.S. and China and a 180 degree pivot by the Federal Reserve fueled the advance. The S&P gained 13 percent in the first quarter following the 13.9 percent decline in the fourth quarter of 2018. However, despite the impressive snapback, it is important to note that the S&P 500 traded at the 2834 level back in January 2018.
Of greater concern is that for the first time since 2007, the yield on the 10-year U.S. Treasury Note was lower than the yield on the 3-month U.S. Treasury Bill, which is known as an inverted yield curve. Specifically, on March 28, 2019, the yield on the 10- year Treasury was 2.39 percent while the yield on the 3-month Treasury Bill was 2.43 percent. The significance of an inverted yield curve is that it preceded the last three downturns as seen in the chart below, and has also preceded every recession over the past 50 years.
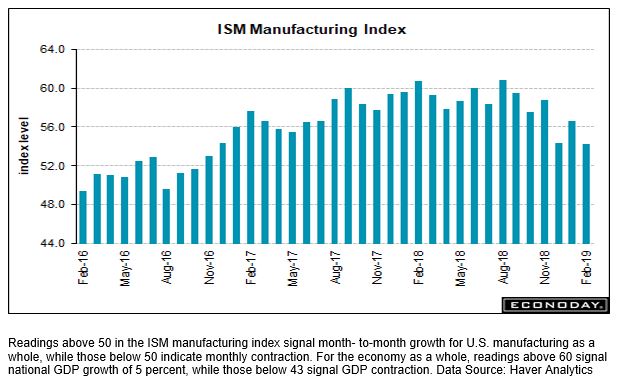
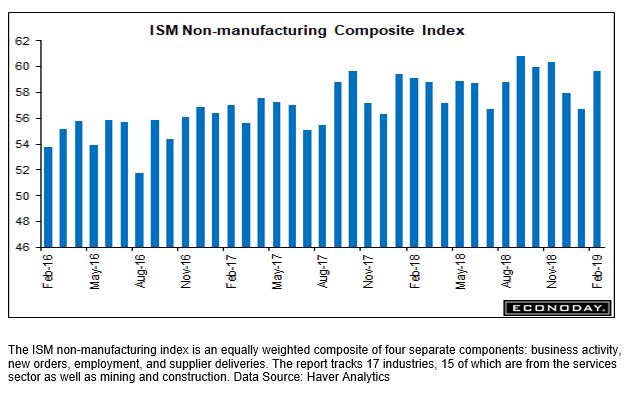
The ISM Manufacturing and Non-Manufacturing Composite Indices
The ISM Manufacturing and Non-Manufacturing Composite Indices are subcomponents in the Economic Cycle indicator in TJT’s proprietary InVEST Risk Model®.
The ISM Manufacturing Index declined to 54.2 in February from 56.6 and the ISM Non-Manufacturing Composite Index increased to 59.7 in February from 56.7. A reading above 50 denotes expansion.
Contact us to learn why this is important when managing your money.
March 2019 Insights
The rally in financial assets continued in the month of February with the S&P 500 index gaining 2.97 percent as the Federal Reserve backed off from their quantitative tightening policy (reducing the size of their balance sheet). However, while the gains since late December are welcome, the reality is that from February 28, 2018 to February 28, 2019 the S&P 500 index is up 2.6 percent, not much more than the yield on the one-year Treasury Bill.
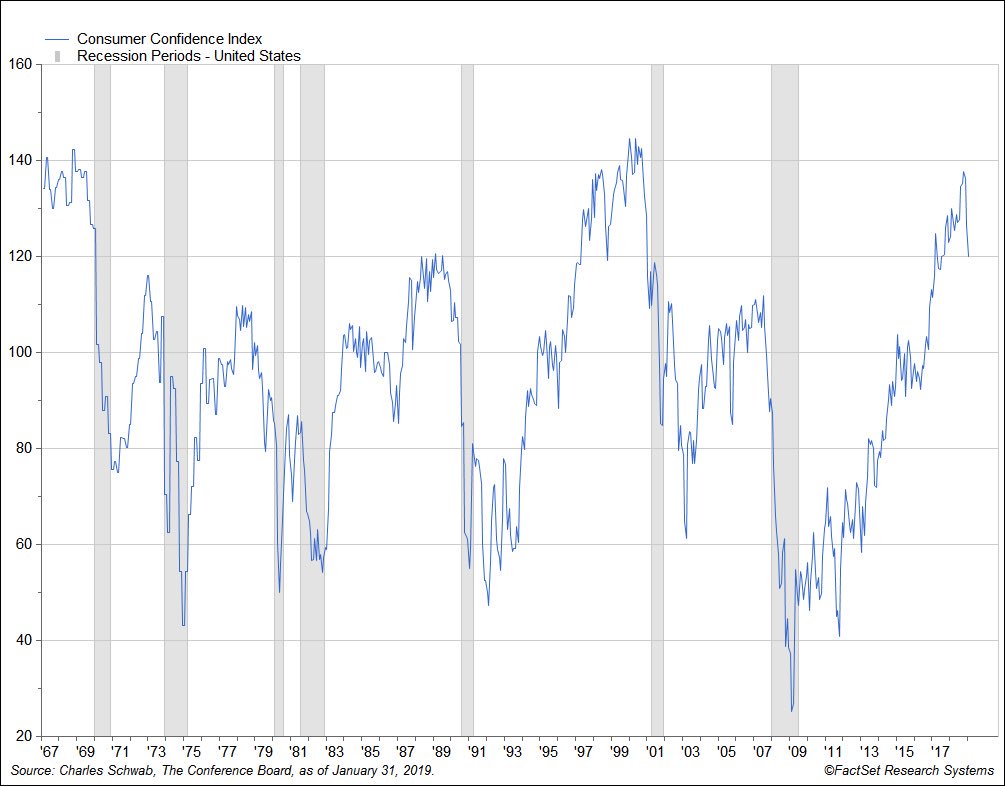
Consumer Confidence Index
The Conference Board’s Consumer Confidence Index is a subcomponent in the Sentiment indicator in TJT’s proprietary InVEST Risk Model®.
The Consumer Confidence Index fell to 120.2 in January from 126.6 in December and 136.4 in November. Sentiment was undoubtedly impacted by the record 35 day government shutdown (12/22/18 – 1/25/19) but to what degree is unknown. The next release is scheduled for Tuesday, February 26th.
Contact us to learn why this is important when managing your money.
February 2019 Insights
The U.S. stock market rallied in January as the S&P 500 index gained 7.8 percent following the 9.1 percent drubbing that took place in December. Concerns about the government shutdown, ongoing trade war with China, and a major policy mistake by the Federal Reserve weighed heavily on the markets late last year. Those concerns receded in January as the government shutdown ended, trade talks with China continued, and the Federal Reserve made a 180 degree reversal in policy.
January 2019 Insights
The U.S. stock market came under intense selling pressure in December as fears of a major policy mistake by the Federal Reserve gripped markets. The U.S. stock market experienced one of the most volatile months in years as the S&P 500 index fell 9.1 percent in December as a slowing global economy, the effects of the ongoing trade war with China, and political uncertainty in the U.S. and Europe also weighed on markets. The decline occurred despite the S&P 500 having the largest single-day point gain in its history.
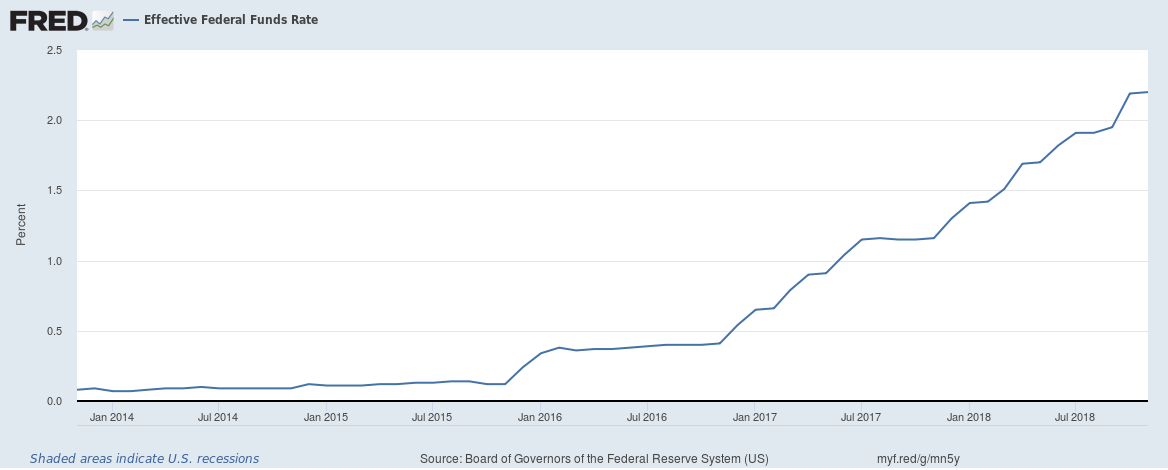
Federal Funds Rate
The Federal Funds rate is a subcomponent in the Interest rate indicator in TJT’s proprietary InVEST Risk Model®.
On Wednesday, December 19th the Federal Reserve raised the federal funds rate 0.25% to a range of 2.25% to 2.50%. It is the ninth increase since the Federal Reserve started raising interest rates in December 2015 and the fourth interest rate increase in 2018.
Contact us to learn why this is important when managing your money.
December 2018 Insights
Volatility spiked in the U.S. stock market in November with several 500-plus point moves in both directions in the Dow Jones Industrial Average. Concerns centered around a deceleration in global economic growth due to the ongoing trade war, a possible policy mistake by the Federal Reserve, the ramifications of a “divided Congress” following the mid-term elections, and a substantial decline in oil prices, among others.
- « Previous Page
- 1
- …
- 9
- 10
- 11
- 12
- 13
- Next Page »